

Every time a recipient clicks "report spam", a mailbox provider records it against your sending domain. Your spam complaint rate is what those clicks add up to, and it is the metric Gmail and Yahoo now watch most closely. Keep it low and your mail reaches the inbox; let it drift up and placement collapses for the whole list — not just the people who complained.
The short answer#
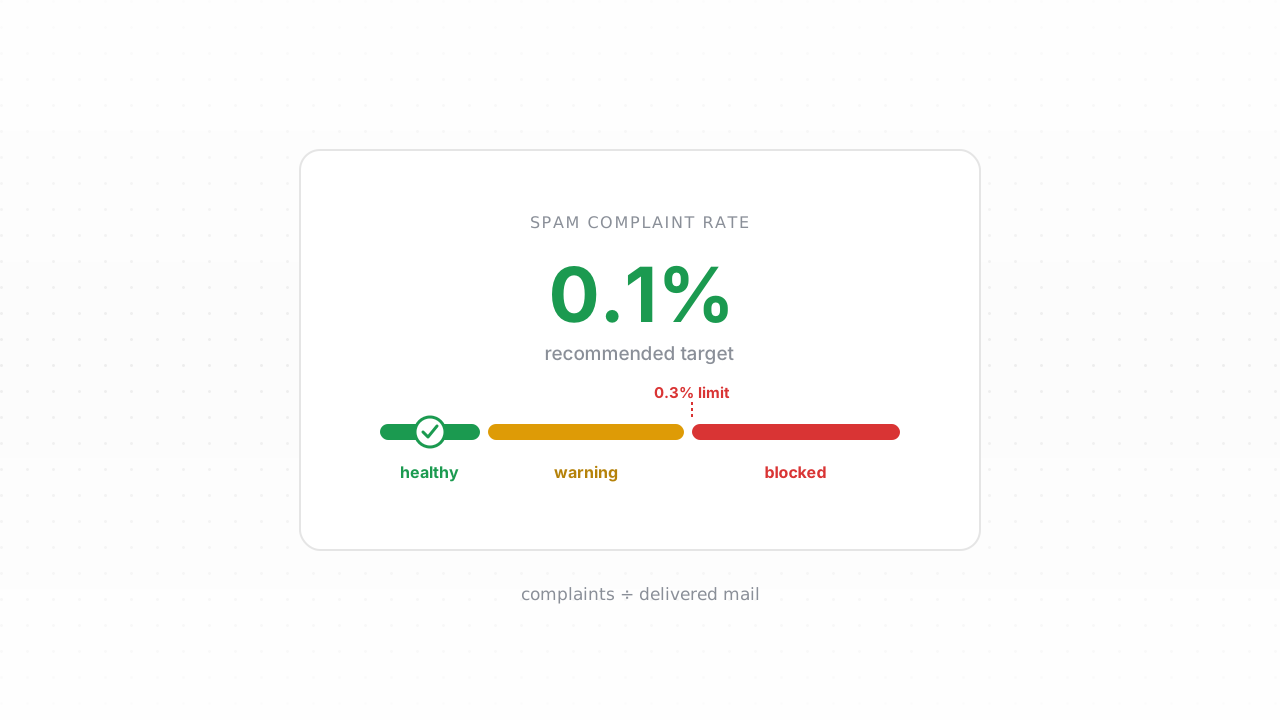
Your spam complaint rate is the number of recipients who mark your mail as spam divided by the number of messages delivered, measured per mailbox provider over a rolling window. Google requires bulk senders to stay under 0.3%, and the practical target is under 0.1% — roughly one complaint per thousand delivered emails. You measure it in Google Postmaster Tools and Microsoft SNDS, and you keep it low with permission-based signups, list verification, sensible frequency, and an unsubscribe link that is easier to find than the spam button.
What the complaint rate actually measures#
The formula is simple: complaints divided by delivered messages, expressed as a percentage.
The two details that trip people up are the denominator and the scope. The denominator is messages delivered, not messages sent — bounced mail never reached an inbox, so it can't be reported as spam and isn't counted here. And the rate is calculated per mailbox provider. Gmail computes your Gmail complaint rate from Gmail recipients only; Microsoft computes an Outlook rate from Outlook recipients. You can have a clean rate at one provider and a failing one at another, which is why you monitor them separately rather than trusting a single blended average.
Providers look at the rate over a rolling window rather than a single send, so one bad campaign raises your average for days. A large clean send can dilute a spike; a small send to an unengaged segment can push the average up sharply. It is a trailing indicator, and it moves slowly in both directions.
The thresholds: 0.3% is the ceiling, 0.1% is the target#
The numbers became concrete in 2024, when Google and Yahoo published shared requirements for anyone sending bulk mail to their users. Both set the same line.
| Complaint rate | What it means |
|---|---|
| Under 0.1% | Healthy. The practical target every program should aim for. |
| 0.1% to 0.3% | A warning band. Placement starts to suffer and you are one bad campaign from trouble. |
| 0.3% and above | The line Google says bulk senders must never sustain. Filtering and blocks follow. |
Read 0.3% as a ceiling you must never touch, not a goal you can sit just below. By the time a rolling rate reaches 0.3%, a lot of individual sends were already much worse, and the damage to reputation is done. The number to manage toward is 0.1% — one complaint per thousand delivered — and the healthiest senders run well below even that. The full set of rules, including authentication and unsubscribe requirements, is covered in our guide to the Google and Yahoo sender requirements.
How to measure your complaint rate#
You cannot manage a number you cannot see, and the providers hand it to you for free:
- Google Postmaster Tools shows your Gmail spam-complaint rate over time, plotted against the 0.3% line, alongside domain and IP reputation. This is the single most important dashboard for any sender with Gmail recipients — verify your domain and check it weekly.
- Microsoft SNDS and JMRP cover Outlook, Hotmail, and Live. SNDS reports reputation and complaint data for your sending IPs; JMRP (the Junk Mail Reporting Program) forwards individual Outlook complaints so you can suppress those recipients.
- Your ESP dashboard reports the complaints it receives through the feedback loops it is registered for. This is the easiest place to look, but it only sees what the providers forward.
The practical setup is to watch the aggregate rate in Postmaster Tools for the trend, and act on the individual complaints your feedback loops and ESP deliver. The trend tells you whether you have a problem; the individual reports tell you who to remove and, when you spot a pattern, which campaign or list source caused it.
Why complaints hurt more than almost anything#
Most negative signals are inferred. A bounce means an address is dead; low opens might mean your subject was weak or the recipient was busy. A spam complaint is none of those things — it is an explicit human statement that your mail is unwanted, delivered by the recipient to the provider. There is no cleaner signal for a filter to act on, and providers weight it accordingly. It is the loudest input into your sender reputation, louder than bounce rate, and it damages placement for your entire list rather than just the complainer.
That last point is what makes complaints so costly. When your rate climbs, the provider does not merely filter the people who complained — it lowers its trust in your domain and starts routing more of your mail to the spam folder for everyone. A handful of complaints from an unengaged segment can suppress inbox placement for your most loyal subscribers, who never complained at all. You are spending the reputation you earned with good recipients on the mail you sent to bad ones.
How to reduce spam complaints#
Nearly every complaint traces back to one of two feelings: "I never signed up for this" or "I can't make it stop." Fix those and the rate takes care of itself.
- Collect with real permission. People rarely report mail they asked for. Confirmed opt-in, where a subscriber clicks a link to verify their address, produces a list that almost never complains — the difference between single and double opt-in shows up directly in this number. Never buy, scrape, or add addresses without consent; those are the lists that generate complaints from the first send.
- Verify and maintain the list. Verification removes dead addresses before they bounce and helps you avoid spam traps, and it is also a hygiene habit that keeps you mailing addresses that still belong to engaged people. A list you clean regularly complains less than one you let rot.
- Make unsubscribing easier than reporting spam. When the exit is hard to find, the spam button becomes the exit. A visible unsubscribe link and a working one-click unsubscribe header — now required for bulk senders — give unhappy recipients a lower-cost way out that doesn't cost you reputation. Honor those requests immediately.
- Send at a sensible frequency. Complaints spike when volume outruns expectation. If someone signed up for a weekly digest and gets daily promotions, the mismatch reads as spam even when the content is fine. Set the cadence at signup and hold to it.
- Be honest in the subject and from name. Misleading subject lines, fake "Re:" prefixes, and unrecognizable sender names all provoke the reflex to report. The recipient should know who the mail is from and roughly what it says before they open it.
- Segment and sunset. Mail your engaged subscribers often and your dormant ones rarely — or not at all. Unengaged recipients are the ones most likely to have forgotten you, and forgetting you is the first step toward reporting you. A sunset policy that stops mailing people after months of silence removes your highest-risk complainers before they cost you anything.
None of these are exotic. They are the same disciplines that protect deliverability generally, and the complaint rate is simply the number that tells you whether you're keeping them.
Frequently asked questions#
What is a good spam complaint rate?#
Under 0.1% — about one complaint for every thousand delivered emails — is the target every sending program should aim for, and the healthiest senders run well below it. Google requires bulk senders to stay under 0.3%, so treat that figure as a ceiling you must never sustain rather than a goal. Because the rate is measured per mailbox provider, check it separately for Gmail and Outlook rather than trusting a blended average.
How do I check my spam complaint rate?#
Use the providers' own free tools. Google Postmaster Tools shows your Gmail complaint rate over time plotted against the 0.3% line, and Microsoft SNDS and JMRP cover Outlook and Hotmail. Your ESP dashboard also reports the complaints it receives through the feedback loops it is registered for. Watch the aggregate trend in Postmaster Tools, and act on the individual complaints your feedback loops and ESP forward.
Why does the spam complaint rate matter so much?#
A complaint is an explicit human statement that your mail is unwanted, which makes it the cleanest and loudest negative signal a filter can act on — stronger than a bounce or a low open rate. Providers weight it heavily, and a high rate lowers their trust in your whole domain, so mail starts landing in spam for your engaged subscribers too, not just the people who complained. That is why a small number of complaints can do outsized damage.
How do I reduce spam complaints?#
Most complaints come from people who don't remember signing up or can't find the exit, so fix both. Collect addresses with confirmed permission, verify and clean your list, and make the unsubscribe link easier to find than the spam button. Then keep frequency sensible, be honest in your subject lines and sender name, and stop mailing subscribers who have gone silent for months before they report you.
Verification won't stop every complaint, but it removes the dead and risky addresses that make lists complain in the first place — the ones most likely to have turned into spam traps or forgotten they ever subscribed. Start with 100 free verifications that never expire, and pair a clean list with the habits above to keep your complaint rate where providers want it.